
Placing a trade on a brokerage app takes about thirty seconds. Choosing the right company to buy from, however, is where most beginners get stuck.
Many first-time investors buy shares simply because the stock price is trending upward, only to watch their investment drop when earnings miss expectations.
Evaluating a stock’s long-term potential often feels intimidating, but the core mechanics are straightforward. By breaking down historical growth rates and future earnings projections, you can assess whether a company is fairly priced.
Table of Contents
Here is a step-by-step, 15-minute checklist you can use to evaluate any publicly traded company for free before placing your first trade.
Step 1: The 2-Minute “Circle of Competence” Test
Before pulling up financial balance sheets or income statements, pass your stock candidate through a basic common-sense filter: Do you clearly understand how this business makes money?
Legendary investor Warren Buffett popularized the concept of the “Circle of Competence.” His rule is straightforward: if you cannot explain a company’s underlying business model in plain language, you have no business owning its shares.
Why Understanding Your Stock’s Model Matters
- Identifying the Right Framework: Neither model is inherently “good” or “bad”; they simply represent different types of businesses. The key is determining whether your target stock fits a predictable, steady growth pattern or a speculative, high-volatility one.
- Aligning Your Valuation Standards: Once you identify which model your stock fits, your evaluation standards become clear. Predictable businesses allow for confident, long-term multi-year projections, while volatile or speculative stocks require a much stricter margin of safety.
- The Investor’s Takeaway: Knowing exactly which category your stock belongs to prevents you from applying the wrong expectations, ensuring your valuation math matches the true operational reality of the business.
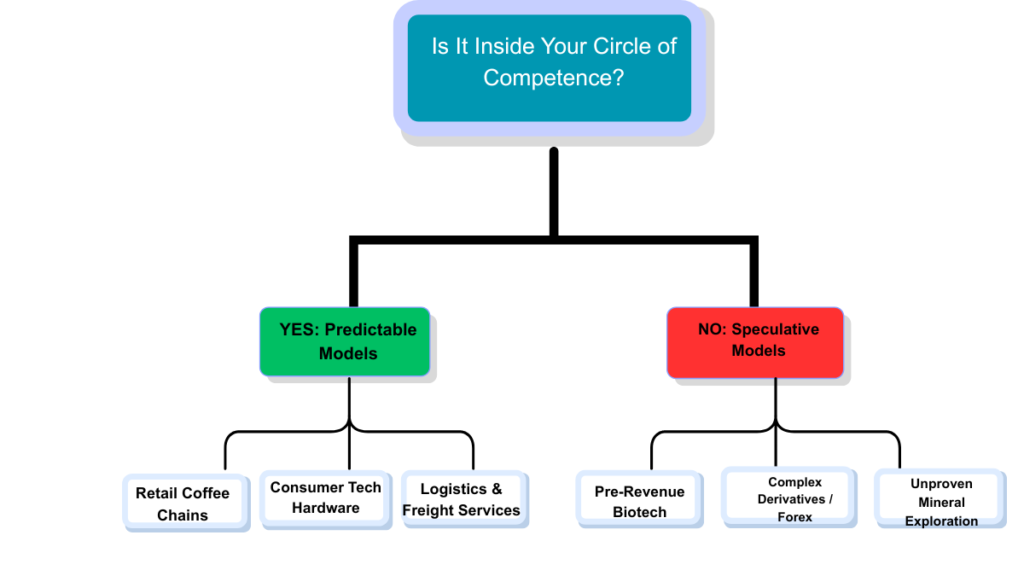
- An Understandable Business: A fast-casual restaurant chain buys raw food ingredients, prepares meals, and sells them at a 15% net profit margin across physical locations and a mobile app. You can track customer traffic, menu price increases, and store expansions.
- A Speculative Business: An early-stage biotechnology firm whose valuation relies entirely on an unapproved clinical drug trial in a medical field you know nothing about.
If you cannot explain what the company sells, who pays them, and why their customers don’t go to a competitor in two simple sentences, cross the stock off your list immediately.
Step 2: Open Free Stock Data Aggregators
You do not need to pay for institutional financial software. Every metric required for fundamental analysis is accessible through free web tools:
- Stock Analysis: Offers a clean layout for reviewing 5-year historical income statements and free cash flow trends without intrusive ads.
- Yahoo Finance: Excellent for searching ticker symbols (e.g.,
AAPLfor Apple or Microsoft) and jumping straight into the Financials and Statistics tabs. - Finviz: Ideal for comparing a company’s valuation ratios against its sector competitors.
Step 3: Verify 3-to-5-Year Financial Trends
Navigate to the Income Statement and Cash Flow Statement on Stock Analysis or Yahoo Finance. You are looking for stability and consistency over time, not one-time performance spikes.

Look closely at three specific metrics across a 3-to-5-year period:
- Total Revenue (The Top Line): Is the total money coming into the business growing year after year? Steady revenue growth shows that demand for the company’s products is expanding.
- Net Income (The Bottom Line): Is the company keeping more profit after paying all operating expenses, wages, and taxes? Growing revenue with shrinking net income means operational costs are spiraling out of control.
- Free Cash Flow: Flip over to the Cash Flow Statement and check Free Cash Flow. Net income can sometimes be distorted by accounting rules, but cash is tangible. You want to see positive, growing cash flow generated from core operations.
Step 4: Run the Numbers: Put Your Stock to the Ultimate Test
Before you risk a single dollar, let’s see what your stock is actually worth. Theory is great, but math tells the real story.
Adjust baseline revenue growth and target Price-to-Earnings (P/E) ratios over a 5-year investment timeline:
Step 5: Validate Your Results Across the 3 Pillars of Valuation
Running numbers through a single model is never enough. Professional equity analysts rely on three core pillars of valuation to cross-check their intrinsic value estimates and protect against flawed assumptions:
- Relative Valuation Pillar (P/E & Multiplier Analysis): Compares a company’s current price-to-earnings ratio against its industry peers and historical averages to see if it is trading at a discount or premium.
- Intrinsic Growth Pillar (The Fundamental Growth Model): Evaluates a stock based on compounding future revenue and cash flow projections (the exact model powering our Step 4 calculator).
- Asset-Based Floor Pillar (Margin of Safety Analysis): Examines net book value, cash reserves, and balance sheet health to establish a solid price floor during market downturns.
Quick-Reference: Key Metrics for Validation
| Financial Metric | What It Measures | What to Look For |
|---|---|---|
| Price-to-Earnings (P/E) | Tells you how many dollars you are paying for every $1 of annual earnings. | Compare it to competitors in the same industry. A P/E of 25 might be reasonable for a fast-growing tech firm, but a P/E of 40 for a slow-growth utility company signals overvaluation. |
| Debt-to-Equity (D/E) | Compares total company liabilities against shareholder equity. | Look for a ratio under 1.5. Companies with excessive debt struggle during economic recessions or when interest rates rise. |
| Profit Margin | The percentage of overall sales converted into net profit. | High, stable margins (e.g., 15%+ or 20%+) indicate the company possesses strong pricing power over rivals. |
When all three valuation pillars and these key financial metrics point toward the same valuation range, you can make your investment decision with complete confidence.
Step 6: Identify Economic Moats & Deal-Breakers
An Economic Moat is a structural advantage that prevents competitors from taking market share and driving down profit margins:
- Brand Loyalty: Customers pay a higher price simply because of brand perception (e.g., Apple, Nike).
- Network Effects: The product or platform becomes more useful as more people adopt it (e.g., Visa, Mastercard).
- High Switching Costs: Replacing the company’s enterprise software is too expensive or complex for clients (e.g., Microsoft, Salesforce).
3 Red Flags to Watch Out For:
- Continuous Share Dilution: Check the historical Share Count line. If total shares outstanding increase every year, the company is issuing new stock to raise cash, diluting your ownership percentage.
- Heavy Executive Selling: If corporate directors and insiders are rapidly selling off their own stock, ask yourself why leadership lacks confidence in the company’s future.
- Unmanageable Debt Interest: If operating income barely covers annual interest payments on debt, any temporary drop in sales can push the business into distress.
Pre-Trade Checklist
Before logging into your brokerage app to execute an order, verify these 5 points:
- Simple Business Model: Can I explain how this company makes money in two sentences?
- Revenue Growth: Has total revenue grown consistently over the past 3 to 5 years?
- Healthy Balance Sheet: Is the Debt-to-Equity ratio comfortably below 1.5?
- Competitive Moat: Does the company hold a clear brand, network, or cost advantage over rivals?
- Fair Valuation: Is the P/E ratio reasonable compared to direct competitors in the same sector?